

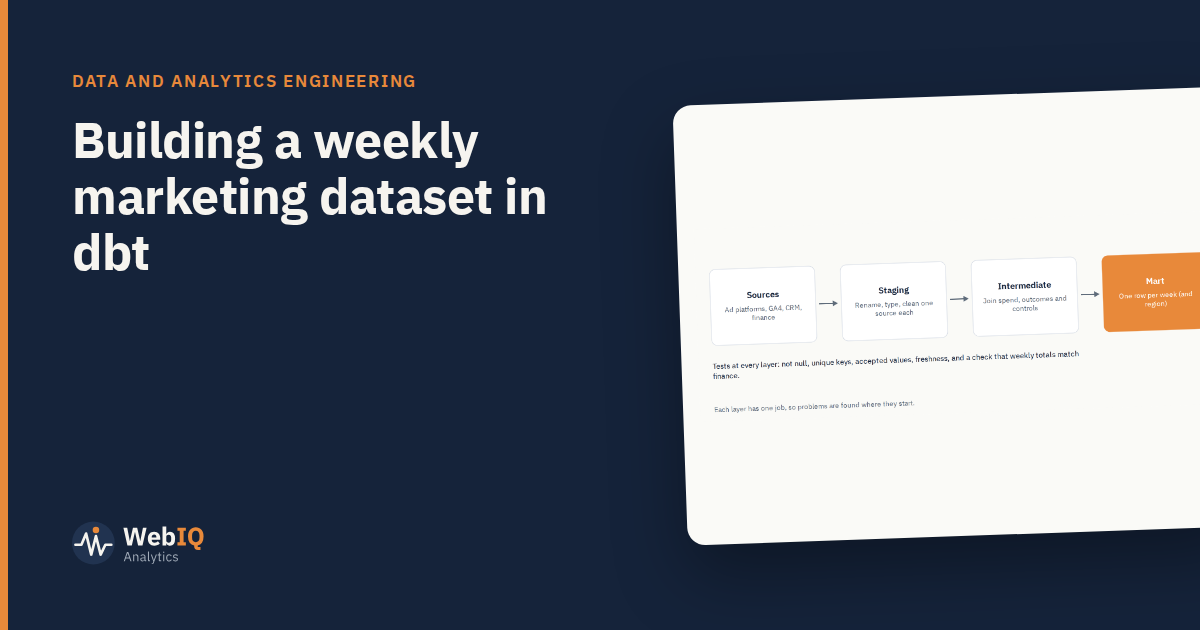
A mix model, a forecast and a performance dashboard all want the same thing: one row per week (and per region, if you model regionally) with spend, outcomes and controls. dbt is a good way to build it and keep it right.
The layers
- Sources. Raw exports from ad platforms, GA4, CRM and finance, declared as dbt sources with freshness checks.
- Staging. One model per source: rename columns, cast types, standardise currency and dates. No joins yet.
- Intermediate. Map platform campaigns to channels, aggregate to weeks, and join spend, outcomes and controls.
- Mart. The modelling table: one row per week and region, one column per channel and control.
Decisions to make once
- Week definition. Monday to Sunday is common; pick one and use it everywhere.
- Channel mapping. A seed file mapping every platform campaign to a channel, owned by marketing and reviewed when campaigns change.
- Spend basis. Delivered spend net of fees, in one currency.
- Outcome definition. Agreed with finance, with returns handled consistently.
Tests worth having
not_nullanduniqueon the week and region keys.accepted_valueson channel names.- Source freshness alerts when a platform export is late.
- A reconciliation test: weekly spend totals within a tolerance of invoices or finance figures.
- A check that no week is missing a channel that should be present.
Keeping it useful
Document every model and column in dbt so analysts and modellers can see where each number came from. Schedule runs to finish before the people who use the data start work. And treat the channel mapping as a living file: most silent errors come from new campaigns that were never mapped.
Built this way, the dataset makes every model refresh routine, and answers finance's favourite question: where did that number come from?