

Marketing teams often build a new dataset for every question: one for the dashboard, one for the forecast, one for the mix model. Each defines weeks, channels and outcomes slightly differently, and none reconcile. A single data model at weekly grain fixes that.
Choose the grain
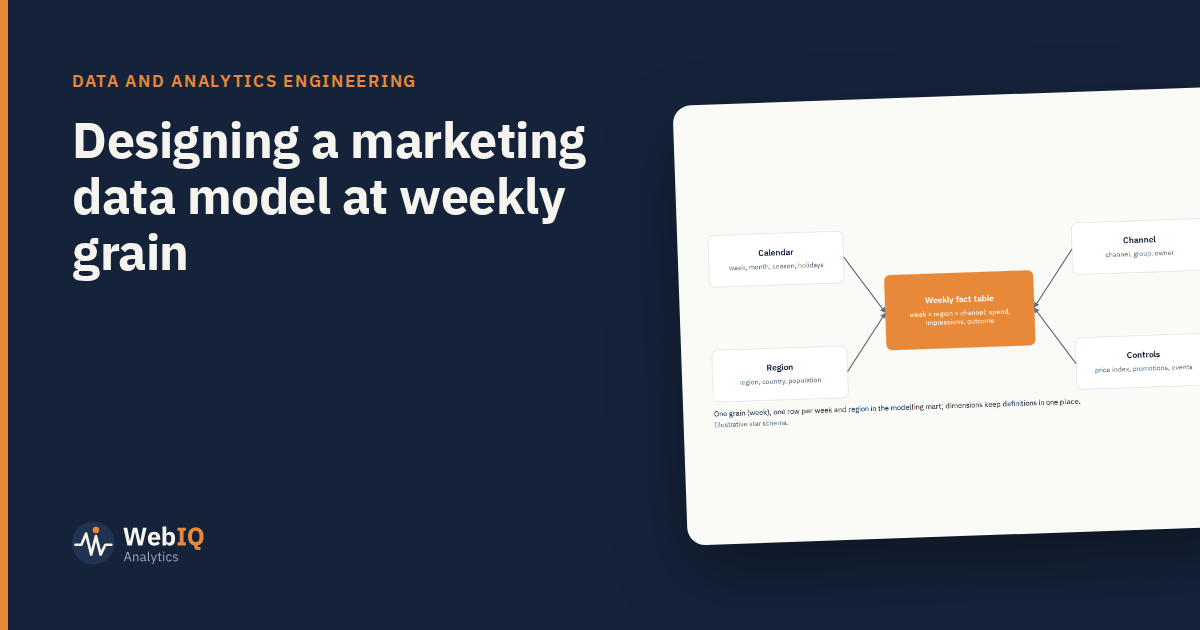
The grain is what one row represents. For marketing measurement, the most useful is one row per week, per region (if you have regions), per channel. Daily data can sit underneath; weekly is what models and leaders use.
The fact table
Holds the measures:
- Spend, impressions and clicks per channel
- Outcomes (orders, revenue, leads) per region and week
- Keys to each dimension
The dimensions
- Calendar: week start, month, quarter, season, holiday flags, trading events.
- Region: region name, country, population or other size measures.
- Channel: channel, channel group, owner, paid or owned.
- Controls: price index, promotion flags and depth, competitor activity, known events.
Keeping definitions in dimensions means a channel renamed once is renamed everywhere.
The modelling mart
From the star schema, build a wide table with one row per week (and region) and one column per channel and control. That's what mix modelling tools expect. Generate it from the model, never by hand.
Rules that keep it trustworthy
- One week definition everywhere (for example, Monday to Sunday).
- One currency and one spend definition.
- Outcomes from the finance source of truth, not from analytics tools.
- Tests on every layer: keys unique, no missing weeks, totals reconciled.
- Documentation for every column, so anyone can trace a number to its source.
What it enables
Dashboards, forecasts and models all read from the same tables, so they agree. Model refreshes become routine, and new questions start from clean data rather than a new extract.