

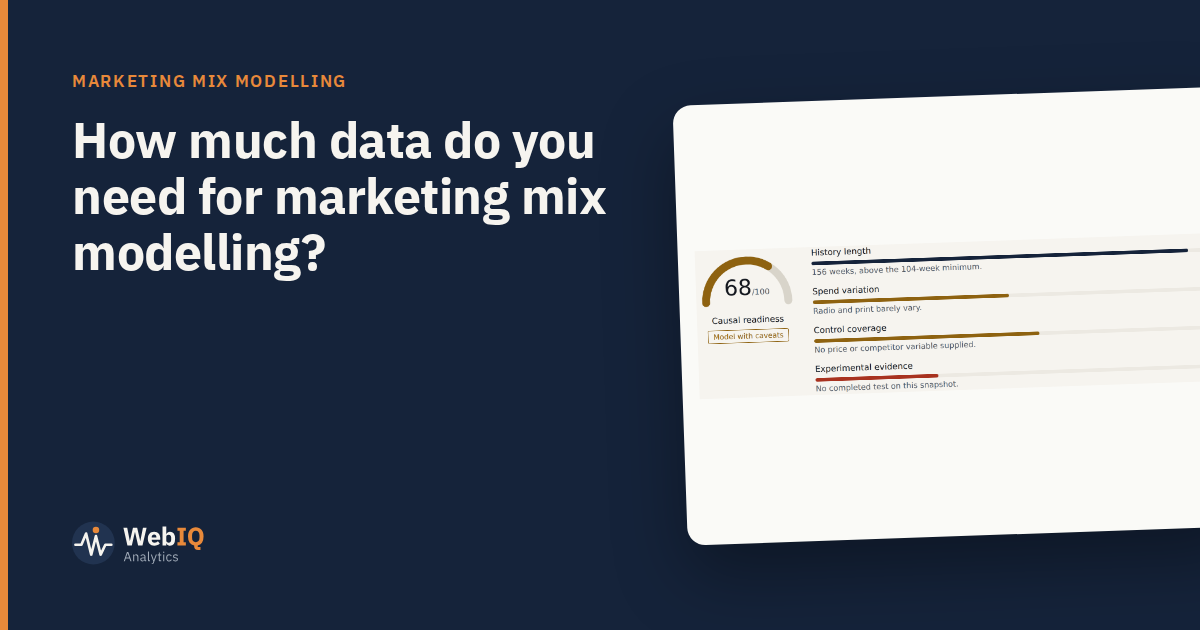
It's the first question most teams ask, and the honest answer is "enough to see each channel change". Here's what that means in practice.
History
Two years of weekly data (104 weeks or more) is the comfortable minimum. It gives the model at least two cycles of seasonality to separate from marketing, and enough weeks of changing spend to learn from. With a year or less, results lean heavily on assumptions; say so in the readout.
Granularity
Weekly is the standard. Monthly data gives a quarter of the observations and blurs carryover. Daily data adds noise without much more information for most budgets. If you have regional data with genuinely different regional spend, it adds a lot of useful variation.
Variation
This matters more than length. A channel whose spend barely changed can't be measured from data alone, however many weeks you have. Before modelling, look at each channel's weekly spend: flat lines will produce assumption-driven results.
Controls
- Price and promotions, with dates. Often the biggest drivers of sales after seasonality.
- Seasonality and holidays.
- Competitor activity, even as a rough index.
- Events: launches, outages, stock-outs.
Missing controls don't stop a model running. They bias it, usually by crediting marketing with sales that price or promotions drove.
What's negotiable
- Less history can work with strong priors and a test to calibrate against, as long as ranges are reported honestly.
- Missing competitor data is common; flag it and move on.
- Imperfect channel splits can be combined into broader groups.
What isn't
An agreed outcome definition, actual delivered spend, and spend that changes over time. Without those, fix the data first.