

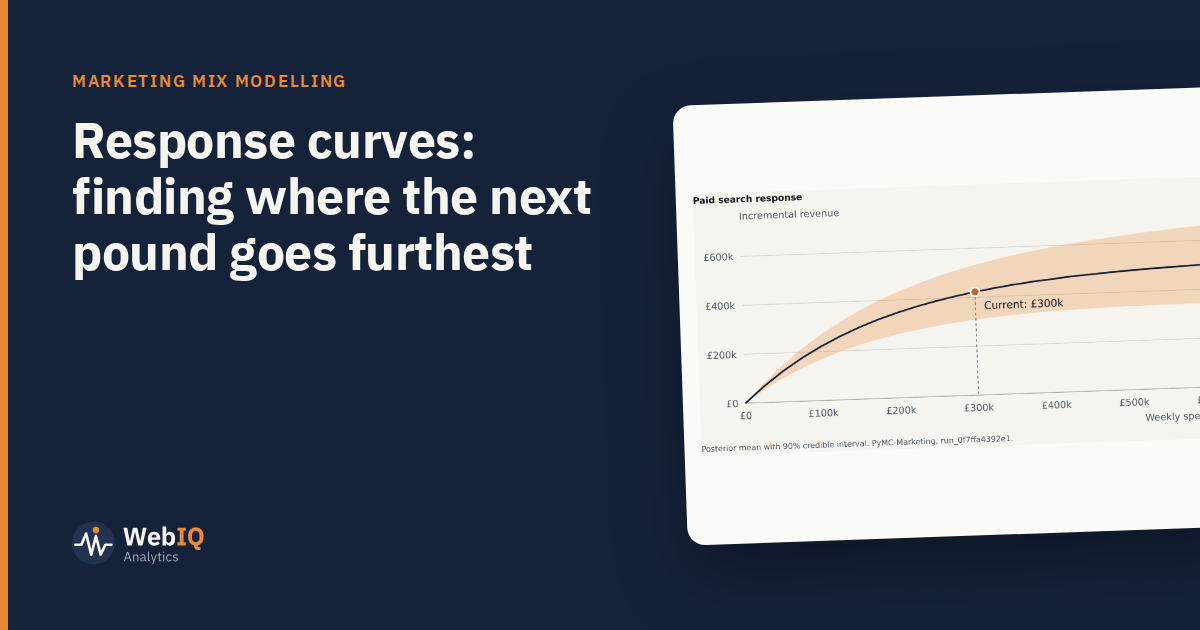
Every channel saturates. The first pound reaches the people most likely to respond; the next reaches people slightly less likely; eventually extra spend mostly repeats the message to the same audience. A response curve shows that relationship for each channel: sales on one axis, spend on the other.
Reading a response curve
- The steep part: extra spend brings back a lot. You're probably under-investing.
- The bend: returns start to fall. Often the efficient zone.
- The flat part: extra spend brings back little. The same money might work harder elsewhere.
Average return versus marginal return
The average return is total sales driven divided by total spend. It describes how a channel did. The marginal return is what the next pound would bring back at today's spend. It describes what to do next.
On a flattening curve, the two can be far apart. A channel can have a high average return and a poor marginal one, because the cheap, responsive part of the curve has already been bought.
Using curves to plan
- Find where each channel sits today on its curve.
- Compare marginal returns across channels at current spend.
- Move budget from channels with low marginal return to those with higher marginal return, at the same total.
- Repeat in small steps, because marginal returns change as you move money.
This is what a budget optimiser does, but doing it by hand once makes the output much easier to trust.
Treat the flat end with care
Curves are estimated from the spend levels you've actually run. Beyond your historical maximum, the model is extrapolating. That's usually where the range is widest and where recommendations should be most cautious.
- Cap recommended changes at, say, 20% to 30% per quarter.
- Prefer moves within the range of spend you've already seen.
- Test before scaling a channel far beyond its history.
Ranges matter here too
A curve is an estimate, not a line on a chart. Ask for its range. Two channels whose curves overlap heavily at the margin can't be ranked confidently, and shouldn't drive big reallocations.
Used well, response curves turn "which channel works best?" into a better question: where would the next pound do the most good?