

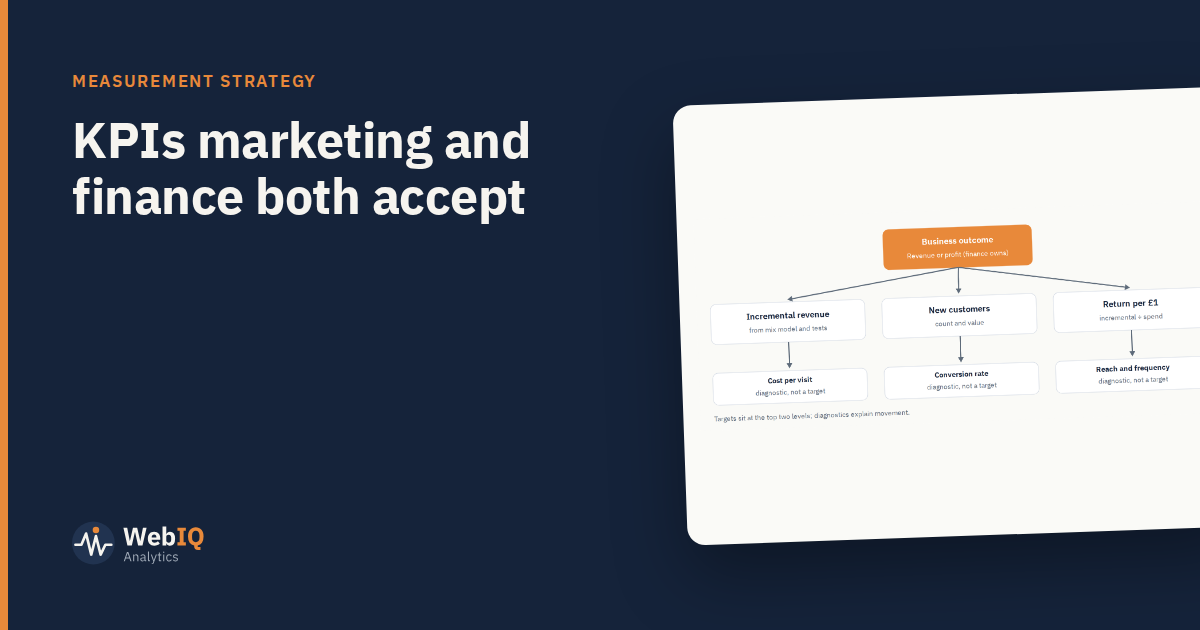
Marketing and finance often report different numbers for the same thing. Marketing quotes attributed revenue and return on ad spend; finance quotes total revenue and margin. Both are right on their own terms, and the gap erodes trust. A shared KPI tree closes it.
Start from the business outcome
The top of the tree is what the business is trying to achieve: revenue, profit, or customers with lasting value. Finance owns its definition.
Marketing KPIs that connect to it
- Incremental revenue: what marketing added, from a mix model and tests, with a range.
- New customers: count and value, from the finance or CRM source of truth.
- Return per £1: incremental revenue divided by spend.
These are the numbers targets are set on.
Diagnostics underneath
Cost per visit, conversion rate, reach, frequency, click-through rate. Useful for explaining why the KPIs moved, and for optimising inside channels. Not targets in their own right: optimising a diagnostic can hurt the outcome above it.
Agree definitions in writing
For each KPI, write down:
- The exact definition, including what's excluded (returns, tax, cancellations).
- The data source.
- The owner.
- How often it's reported, and over what period.
Finance and marketing both sign it. Most disagreements disappear at this step.
Report with ranges
Incremental measures are estimates. Report them with a likely range and the method used. Finance teams are used to uncertainty in forecasts; they distrust precision that isn't real.
Review twice a year
Business priorities change. Check the tree still reflects them, retire KPIs nobody uses, and add new ones only with a definition and an owner.
A short, agreed KPI tree ends the argument about whose number is right and starts the conversation about what to do next.